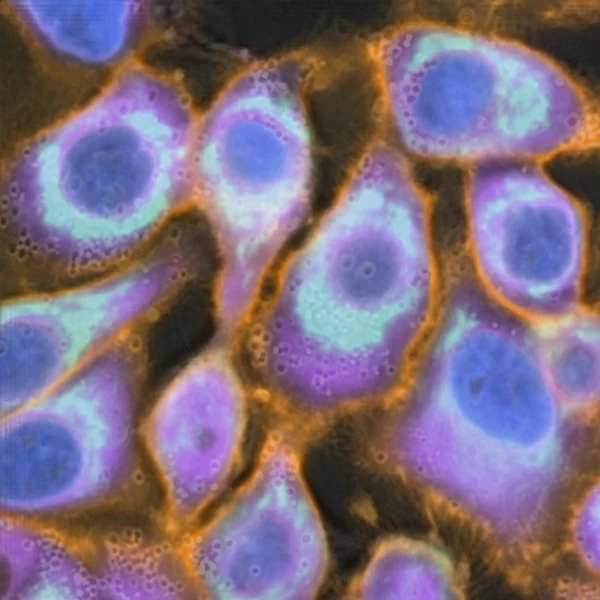
Analyses of individual cells
Higher and against the paired fluorescence and, for VSCyto3D and Pix2Pix3D, the most consistent predictions from frame to frame.
- Organelle localization
- Cell segmentation and counting
- Cell tracking
FNet3DVSCyto3DPix2Pix3D
NeurIPS[2026]
* equal contribution† corresponding author
Understanding how cells respond to perturbations over time is central to cell biology and drug discovery. Live-cell imaging captures the dynamics of perturbation-induced phenotypes in individual cells. While fluorescence imaging can visualize specific molecular phenotypes, labeling and repeated illumination often affect cell health. Virtual staining offers an alternative by predicting these fluorescence images from images acquired without fluorescent labels. Although many virtual staining models have been developed, their performance on volumetric time-lapse data remains poorly characterized. We address this gap with an evaluation suite for 3D time-lapse virtual staining of live cells. The suite combines paired 3D time-lapse images acquired with and without fluorescent labels, a set of baseline models, and three metric tiers measuring pixel-level fidelity, organelle segmentation performance, and single-cell phenotype similarity. Using this evaluation suite, we study metric and model behavior across 3 cell types, 2 microscopes, 4 organelles, and 3 perturbation states. We find that regression baselines better predict the spatial localization of target organelles, whereas the generative baseline better captures the distribution of phenotypes across cells. These differences expose trade-offs between structural and phenotypic fidelity that are obscured by single-metric evaluation and suggest how virtual staining models can be developed for diverse downstream tasks such as localization, segmentation, tracking, and phenotypic profiling. We release the curated datasets, baseline checkpoints, and evaluation code as part of DynaCell, a broader framework for image-based profiling of cell-state dynamics.
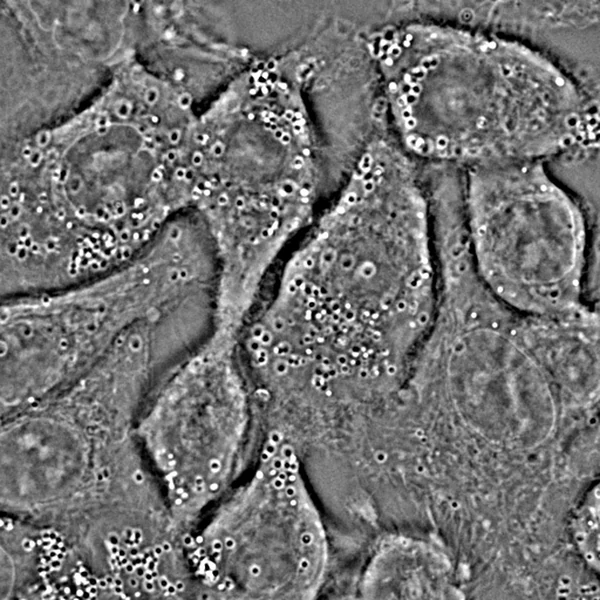
Image-based profiling of cells under genetic, chemical and infectious perturbations has become central to cell biology and drug discovery. Many perturbations alter the organization of organelles, such as the nucleus and the mitochondria, over hours, and capturing these changes requires repeated imaging of living cells. Fluorescence imaging can resolve individual organelles, but repeated illumination harms the cells and bleaches the fluorescent labels.
Virtual staining addresses this tradeoff by predicting fluorescence-like images of organelles from label-free images of the same cells. It is an image-to-image translation task. A model is trained on paired label-free and fluorescence images, then applied to label-free images alone.
Virtual staining has three advantages over fluorescent labelling:
Label-free image ()
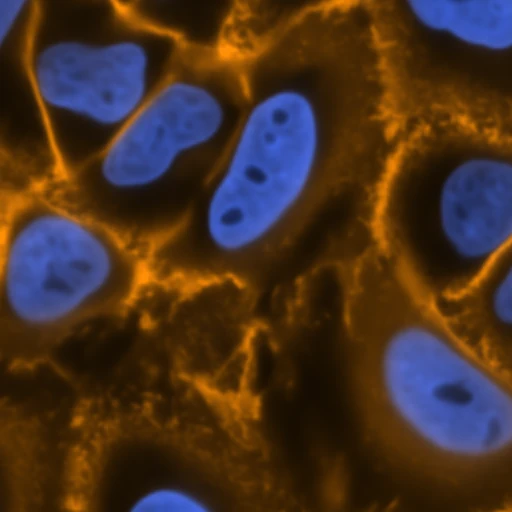
Virtual stain (predicted)Each organelle needs its own fluorescent label, and each additional label increases the light dose and narrows the spectral window available to the others. In the A549 data shown here, one cell line carries both the nucleus and membrane labels, while the ER and mitochondria are both imaged in the green channel and so are labelled in two further cell lines. Images of organelles from different cell lines show different cells and cannot be combined.
Virtual stainingpredicted · VSCyto3D
Virtual staining predicts all four organelles in the same cells, from one label-free movie.
Even with light-sheet imaging, fluorescent labels photobleach over a multihour acquisition, so the signal fades with every exposure. A label-free image contains no fluorophore and does not bleach.
Photobleaching also weakens the experimental reference against which predictions are scored. The DynaCell evaluation suite introduced below therefore includes , a frequency-aware correlation that down-weights spatial frequencies where the experimental signal has faded into noise.
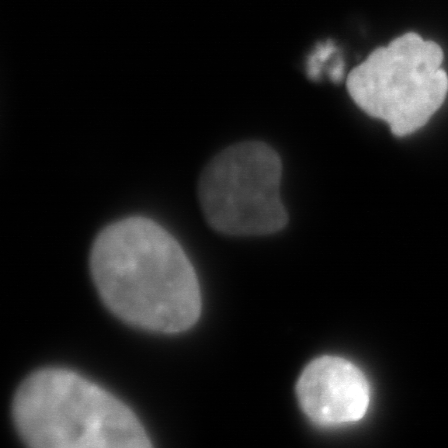
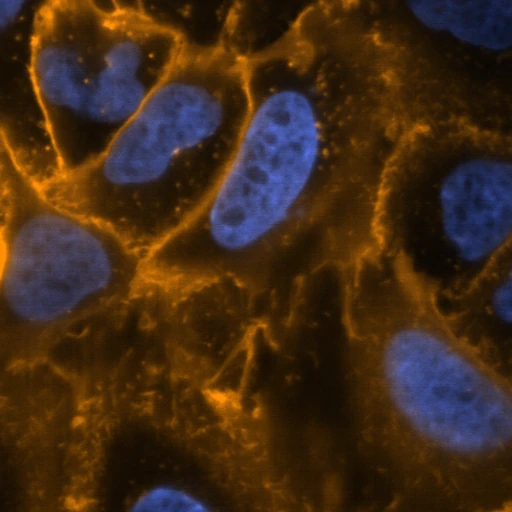
5 hpi10 µmH2B fluorescence
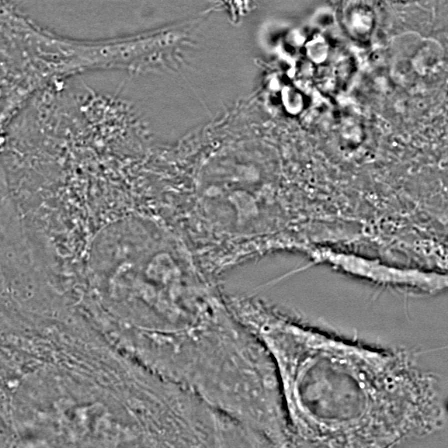
5 hpi10 µmPhase
Many image-to-image models have been developed for virtual staining, from regression to adversarial and generative models. Their predictions often look equally plausible, as in this held-out test image (field of view, FOV) of uninfected (Mock) A549 cells.
Most studies report only pixel-level metrics, which measure resemblance to the target image but not whether a prediction can replace experimental fluorescence for segmentation, cell tracking or phenotypic profiling.
Prediction from
Trained on A549

ExperimentPrediction10 µmThe DynaCell evaluation suite assesses 3D time-lapse virtual staining of live cells. It combines paired label-free and fluorescence data, baseline models, and three tiers of metrics that compare each prediction with experimental fluorescence, one for each kind of analysis a virtual stain might replace:
The data cover four organelles in two cell types (iPSC and A549), over time and under infection; the baselines are regression, adversarial and generative models trained under one protocol. A model can score well on one tier and poorly on another.
The best model depends on the tier. Regression and adversarial models agree more closely with the paired fluorescence at the pixel and segmentation tiers, whereas the generative model better reproduces the distribution of phenotypes across cells.
Higher and against the paired fluorescence and, for VSCyto3D and Pix2Pix3D, the most consistent predictions from frame to frame.
FNet3DVSCyto3DPix2Pix3D
The best for every organelle, training set and test set, and the closest agreement with the experimental response to DENV and ZIKV infection.
CELL-Diff3D
Yes. In every organelle and test set, CELL-Diff3D has the lowest and the best .
si-SSIM, higher is better. Tick: untrained reference.
Tracking cells or measuring organelle dynamics requires predictions that are consistent from one frame to the next; otherwise, differences between frames appear as biological change. This time-lapse has no experimental fluorescence, so each prediction is compared, with , with the same model's prediction for the previous frame.
The test-set predictions behind these results can be inspected alongside their scores, and the baseline models can be tried in a Hugging Face demo.
Two iPSC and two A549 Mock test FOVs per organelle. Compare experimental fluorescence with every model and training set, with each column's test-set scores beneath it.
A demo of DynaCell baseline models on held-out A549 test FOVs.
Choose a model for each organelle and overlay all four predictions on one FOV of A549 cells.
@inproceedings{kalinin2026dynacell,
title = {The DynaCell Evaluation Suite for Dynamic 3D Virtual Staining of Live Cells},
author = {Kalinin, Alexandr A. and Zheng, Dihan and Theodoro, Taylla Milena and Ivanov, Ivan and Hirata-Miyasaki, Eduardo and Lee, See-Chi and Liu, Aofei and Varra, Sricharan Reddy and Chandler, Talon and Pradeep, Soorya and Liu, Chad and Leonetti, Manuel D. and Arias, Carolina and Huang, Bo and Mehta, Shalin B.},
booktitle = {Advances in Neural Information Processing Systems},
year = {2026},
url = {https://biohub.github.io/dynacell/}
}